The ROS Wheel: Refining ROS Transcriptional Footprints
这是一篇2016年的一篇文章但是其中有个meta分析思路我觉得非常有意思,一个是基于差异基因的list转化为研究与研究的聚类,对研究进行了聚类划分为8大类,同时作者利用REM 方式替换掉了原来的一致性(简单取交集)方法扩充了cluster中的差异基因数目.后续就常规的对cluster进行分析了,什么核心通路啊,核心基因,GSEA等
这篇文章发表于《植物生理学》杂志,2016年7月,作者主要研究了氧化应激对拟南芥(Arabidopsis thaliana)的转录组的影响。在过去的十年中,微阵列研究为我们提供了大量的信息,展示了各种氧化应激如何改变mRNA的水平。尽管以前的研究为我们提供了有关ROS(活性氧)在植物中的功能的宝贵信息,但这些研究通常使用了简化的统计框架,这对于大规模分析并不合适。因此,作者重新分析了79个关于红ox平衡扰动实验的Affymetrix ATH1微阵列研究,以更系统地解释转录组数据。这些重新分析的数据揭示了各种代谢途径和基因家族的调控,并强调了在系统背景下解释转录组数据的重要性
来自79个独立的ATH1微阵列研究的数据,这些研究涉及了不同的实验设置,都与ROS(活性氧)稳态的破坏有关。这些ROS的扰动是由化学处理、基因修饰、环境压力或它们的组合引起的。所有的微阵列研究包括一个或多个的转录组特征,总共有157个特征,这些特征被组织成12个扰动类别。也就是下面作者文章中图一总结很详细。其实这里也就是表现出我们获取癌症样本或者同是ROS或者其他反应时候也应该关注方法。或者实验背景信息,文章中作者做meta分析不是从去批次角度思考的。所以蛮有意思的。
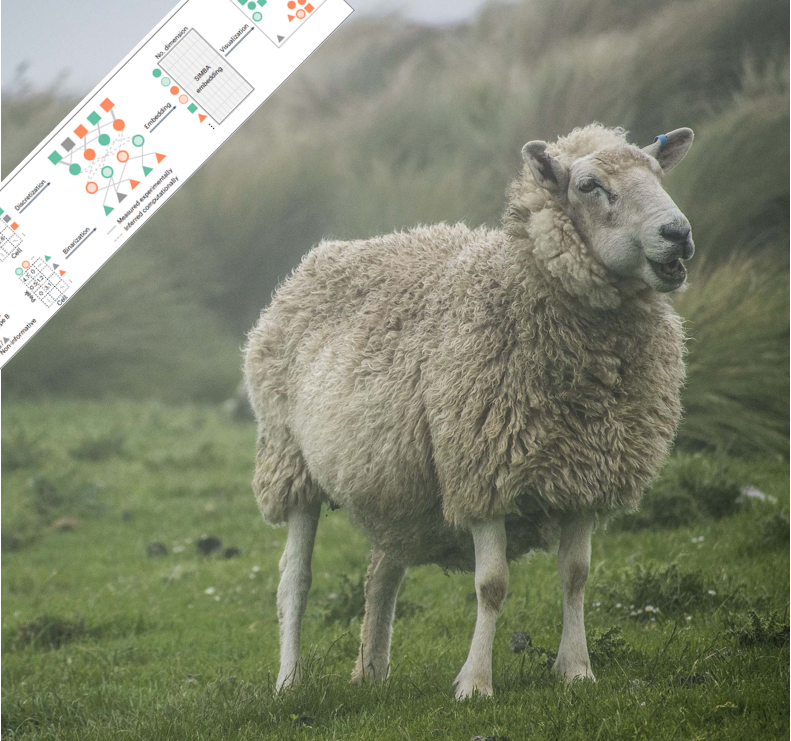
ROS transcriptional profiles and perturbation categories. Transcriptional profiles monitoring ROS homeostasis perturbations were classified under 12 categories (boldface text). For each perturbation category, the number of transcriptional profiles is given. These profiles monitor the transcriptional changes of chemical treatments, environmental stresses, and/or genetic backgrounds. cyt b6f, Cytochrome b 6 f; DMBIB, 2,5-dibromo-6-isopropyl-3-methyl-1,4-benzoquinone; FLS2, FLAGELLIN SENSITIVE2; NO, nitric oxide; PNO8, N-octyl-3-nitro-2,4,6-trihydroxybenzamide; SOD, superoxide dismutase; VIS, visibl

原材料和处理方法
微阵列数据收集:总共收集了来自79个独立研究的680个CEL文件,这些数据来自公共仓库Gene Expression Omnibus (GEO)、ArrayExpress,或者直接向作者请求,以及内部进行的研究。所有包含的微阵列数据都进行了质量控制,并包括了四个未发表的微阵列研究。
微阵列数据处理和差异统计:所有的原始强度文件使用R/Bioconductor的==affy==包(版本1.40.0)通过稳健的多阵列平均(robust multiarray averaging)进行了标准化。探针集使用来自BrainArray的The Arabidopsis Information Resource 10 CDF注释进行了更新。使用==limma包(版本3.18.13)==通过==经验贝叶斯调节的t统计==来分析差异基因表达。扰动与对照条件(ROS/对照)进行了对比分析。在基因扰动的情况下,野生型或增益功能植物与功能丧失或对照株进行了区分。
相似性计算方式是基于差异基因list,也就是每个研究会得到一个差异基因然后看他们交集占两个之和的比例,最后1-相似矩阵就得到距离矩阵了。这里差异基因的集合作者是没有用REM的,REM是在聚类好之后,取得到一个cluster的差异基因来表示这个cluster的footprints所以在后面用。

相似性转录组特征和层次聚类:使用P ≤ 0.01作为显著性阈值,以及log2 FC大于1或小于-1来为每个转录组响应选择差异表达基因(DEGs)。这个相对宽松的阈值被选择是为了在聚类分析中更少地限制DEGs的选择,从而有利于区分相似的特征。使用Dice相似系数(DSC)来评估每个DEG列表之间的成对相似性。然后,使用Dice不相似性(1 − DSC)矩阵作为R中层次聚类(平均链接)的距离度量。使用固定高度阈值分配聚类。为了生成ROS轮,使用R中的ape包(版本3.2)的write.tree函数创建了相应的Newick树。Newick树被导入到Dendroscope3中,并转换为径向布局。(下图就是作者分出来的类我觉得蛮合理的。)

- REM: 这里作者就是为每个研究的Gene创建了一个新的logFC,考虑了随机效应,这是一个线性函数中用一个区间值代替原来的多个协变量。如下图,log FC变为了置信区间,这样我们只要我们cutoff 复合其中一个就可以了,也就增大了燕来取交集方法的基因集合。

- 后续分析M: 后续就是基于模块进行功能注释,交集情况,不同cluster解读等了。功能注释作者做得比较全用了几个库,看下面话来说我觉得蛮有意思的,结合了GO,KEGG,plantCyc还有一个protein family 这个就少见了,
To test whether the obtained transcriptional footprints showed the regulation of biological processes, we performed a gene set enrichment analysis (GSEA) on the induced and repressed genes shaping the REM-derived transcriptional footprints. Enrichment for Gene Ontology (GO) pathways (Kyoto Encyclopedia of Genes and Genomes [KEGG] and PlantCyc) and protein family gene sets was assessed using the PlantGSEA tool


总结
我觉得这个方法很好,而且我觉得和现在很多文章比思路其实还是很有意思的,而且如果用到分型上是不是又是一种有意思的事情呢。当然也提醒我在收集数据时候,处理背景信息必须了解和明确才能够更好的进行下一步研究和解析。然后处理t检测 经验贝叶斯也是可取之处。当然作者说了自己提出了一个新的meta分析框架哈哈。
文档信息
- 本文作者:Xiong
- 本文链接:https://xiongsircool.github.io/xiongbook/2023/11/01/The-ROS-wheel-refining-ROS-transcriptional-footprints/
- 版权声明:自由转载-非商用-非衍生-保持署名(创意共享3.0许可证)